Q1 2023 Market Pulse Survey Results
The Market Pulse Survey gathers on-the-ground information about local market conditions from members of East Tennessee REALTORS® based on their client interactions and real estate transactions in the previous three months. The Q1 2023 iteration of the survey was conducted online from March 16-23, 2023, and received a total of 218 responses.
Key Findings
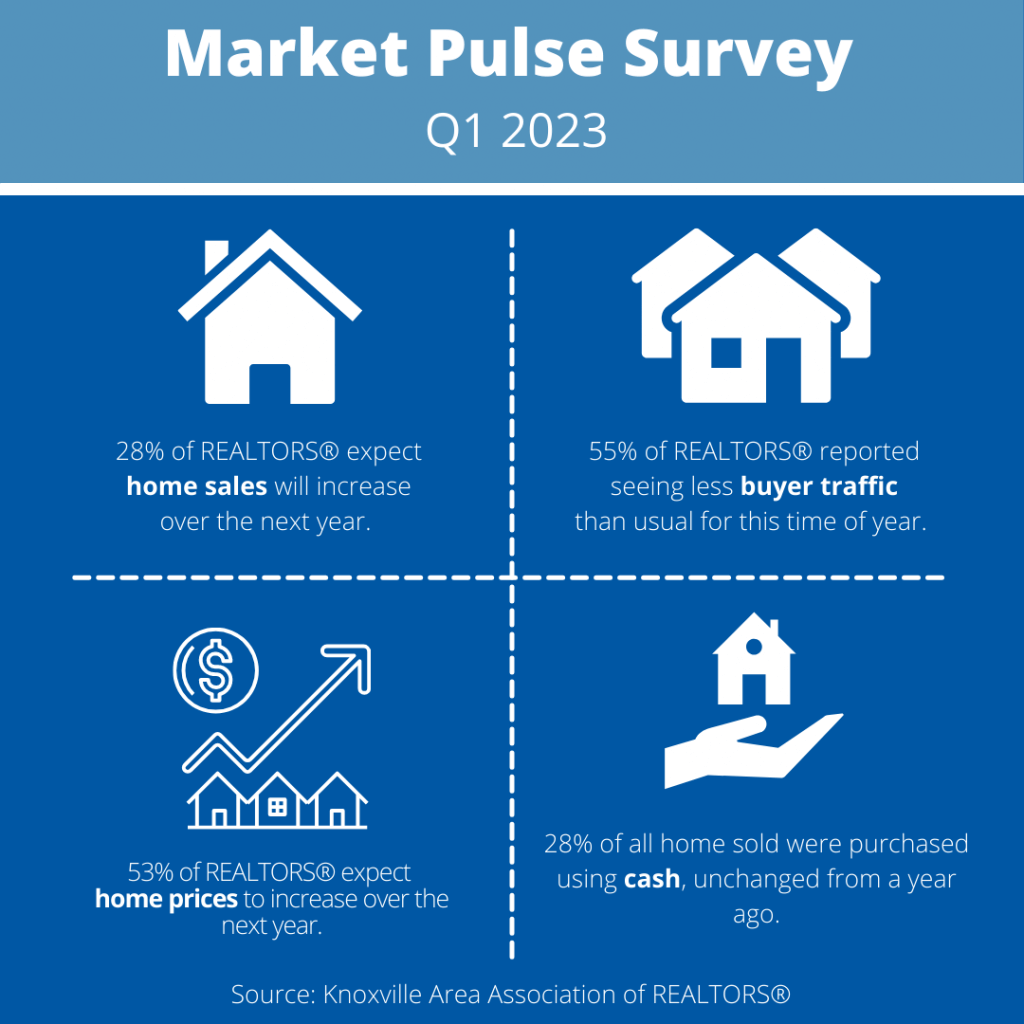
- Buyer traffic ticked up in the first quarter. 55% of respondents reported seeing less buyer traffic than this time last year, compared to 68% the previous quarter. By comparison, seller traffic declined further with 59% of respondents reporting less seller traffic than this time last year.
- REALTORS® expect buyer traffic to remain relatively stable over the next three months, with 44% of respondents expecting lower-than-usual buyer traffic. Expectations about future seller traffic were split, with 37% of respondents expecting seller traffic to stay about the same and 39% expecting seller traffic to be less than usual.
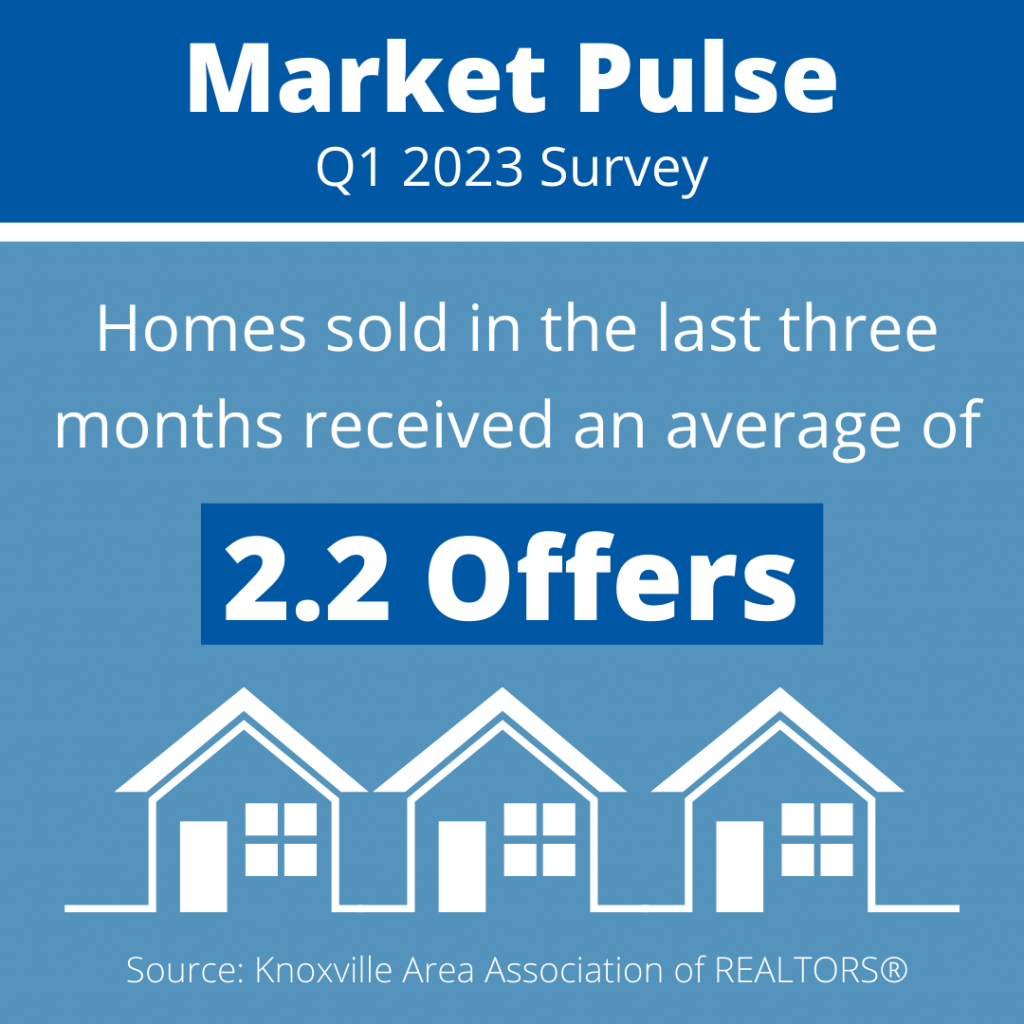
- Respondents reported receiving an average of 2.2 offers on homes sold in Q1 2023, unchanged from the previous quarter but down from 6 offers in Q1 2022.
- 42% of REALTORS® expect home sales will decrease over the next year, down from 56% the previous quarter. 31% expect home sales will stay about the same, and 28% expect home sales will increase.
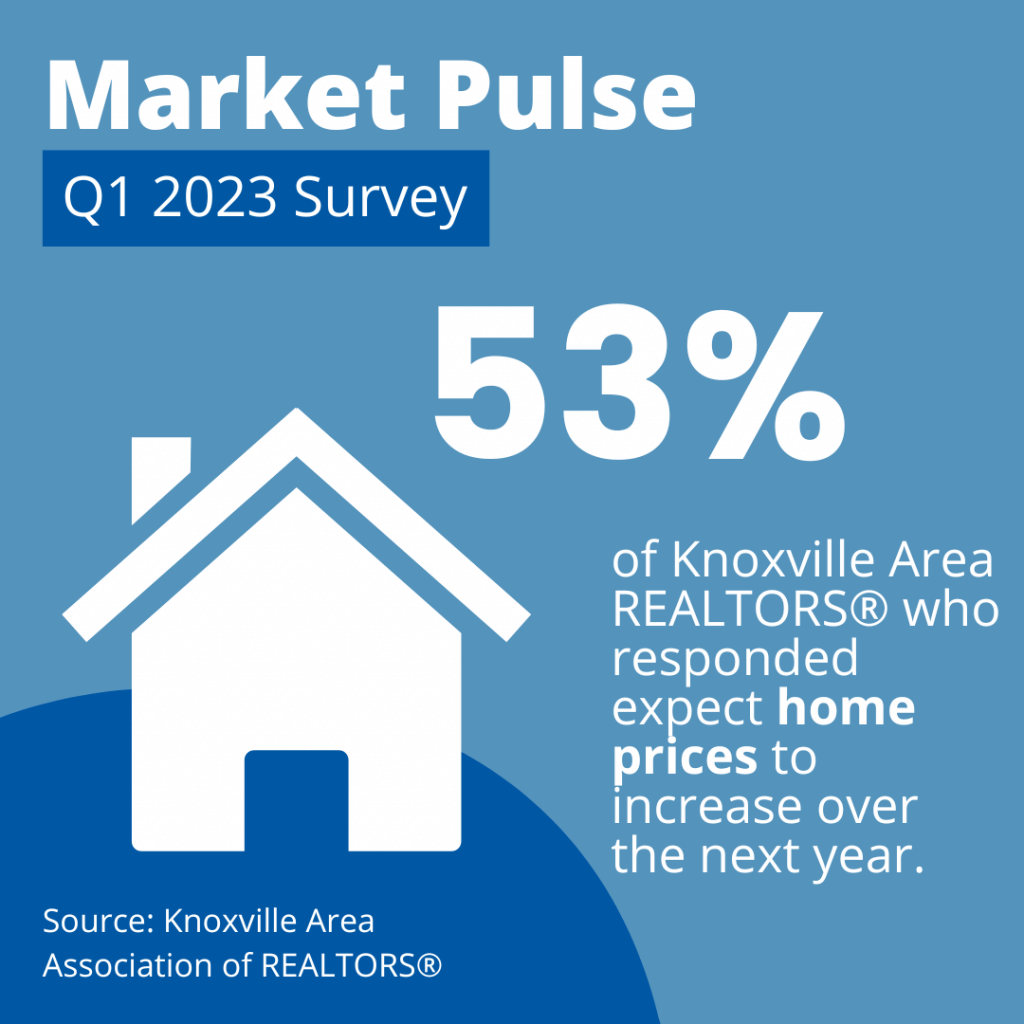
- Industry expectations regarding home prices remain relatively strong. 71% of respondents said they expect home prices will either stay the same or increase over the next year, with 52% saying they expect prices to increase.
- All-cash sales represented 28% of all home sales in Q1 2023, unchanged from the previous quarter and a year ago.
- Out-of-town buyers as a share of all home sales have declined precipitously over the past year. Buyers relocating from another area represented just 8% of all home sales, compared to 24% of sales in the first quarter of 2022.
- REALTORS® reported fewer problems with appraisals. Only 5% of homes sold in the past three months had an appraised value that was less than the purchase price, down from 15% a year ago.
- 47% of buyers in the past three months waived at least one contingency in their purchase contract, down from 63% a year ago.
| Market Outlook | Q1 2023 | Q4 2022 | Q1 2022 |
| Percent of respondents who expect a year-over-year increase in buyer traffic in next 3 months | 17% | 21% | 62% |
| Percent of respondents who expect a year-over-year increase in seller traffic in next 3 months | 20% | 17% | 36% |
| Percent of respondents who expect home sales to increase over the next year | 28% | 17% | 56% |
| Percent of respondents who expect home prices to increase over the next year | 53% | 38% | 88% |
| Key Market Indicators | Q1 2023 | Q4 2022 | Q1 2022 |
| Median days on market | 21 | 14 | 5 |
| First-time homebuyers, as percent of sales | 24% | 14% | 13% |
| Sales for non-primary residence use, as a percent of sales | 8% | 13% | 22% |
| Cash sales, as percent of sales | 28% | 28% | 28% |
| Off-market, as percent of sales | 13% | 12% | 15% |
| Average number of offers received on the most recent sale | 2.2 | 2.2 | 6.2 |
| Buyer and Seller Trends | Q1 2023 | Q4 2022 | Q1 2022 |
| Percent of sellers moving somewhere else in current city/county | 38% | 40% | 38% |
| Percent of sellers moving somewhere else in Tennessee | 20% | 29% | 27% |
| Percent of sellers moving to a different state/outside of Tennessee | 40% | 31% | 35% |
| Percent of buyers moving due to relocation (such as for business or a job change) | 8% | 8% | 24% |
| Percent of buyers who were previously renting | 33% | 24% | 20% |
| Percent of buyers who are repeat homebuyers | 43% | 51% | 46% |
| Other Market Indicators | Q1 2023 | Q4 2022 | Q1 2022 |
| Percent of buyers who waived at least one contingency | 47% | 47% | 63% |
| Percent of buyers who waived inspection contingency | 14% | 15% | 35% |
| Percent of buyers who waived appraisal contingency | 23% | 20% | 43% |
| Percent of contracts where appraised value met or exceeded the contract price | 95% | 93% | 85% |
| Percent of contracts in the past 3 months that were terminated | 5% | 6% | 8% |
| Percent of contracts in the past 3 months that had delayed settlement | 14% | 18% | 20% |
| Percent of contracts in the past 3 months that closed/settled on time | 81% | 76% | 71% |
| Percent of contracts with a delayed settlement that had appraisal issues | 4% | 7% | 13% |
| Percent of respondents who have worked with an investor buyer in the past three months | 38% | 40% | 55% |
| Percent of respondents who listed 3+ properties in the past month | 19% | 22% | 26% |
| Percent of respondents currently working with 3+ clients actively/seriously looking to purchase a home | 42% | 30% | 68% |
| Source: East Tennessee Realtors® | |||
| Note: Estimates based on East Tennessee Realtors' quarterly Market Pulse Survey and MLS data. | |||
"The housing market is still facing headwinds as economic uncertainty and higher mortgage rate have slowed buyer and seller activity alike," said Hancen Sale, KAAR's Government Affairs and Policy Director. "However, our latest survey suggests Realtors® remain cautiously optimistic and their outlook on the housing market is improving, especially as it relates to prices. For instance, a majority (53%) of local Realtors® expect home prices to increase over the next year, albeit at a slower pace. This is a substantial change from just 6 months ago when over 44% expected home prices to decrease.
About the Survey
- The Market Pulse Survey gathers on-the-ground information about local market conditions from members of East Tennessee REALTORS® based on their client interactions and real estate transactions in the previous three months.
- The Market Pulse Survey is provided by East Tennessee REaltors solely for use as a reference. Reproduction, reprinting or retransmission in any form is prohibited without written permission.
- Media inquiries about the survey should be directed to Hancen Sale at hancen@kaarmls.com.
Data Attribution: You are welcome to use or reproduce this survey data for your own purposes, but we ask that you attribute any full or partial use of the data to East Tennessee REALTORS® and include the time period when the survey was conducted.
| Copyright © 2022 EAST TENNESSEE REALTORS® |


